Overview
What is SolarWinds NPM?
SolarWinds NPM is a monitoring and performance management platform. It provides performance troubleshooting support, auto network discovery, customizable thresholds, and can be rapidly deployed.
The way to monitor your network.
NPM is a great tool for your networking team!
SolarWinds Network Performance Monitor (NPM): A Great Tool Including NetPath
Network monitoring made easy using SolarWinds NPM
SolarWinds NPM brings all your Network Tools into a single Toolbox
Single Window Network Performance Monitoring
An honest review of SolarWinds NPM from a Network Operations Manager at a major US Airline
Complete network monitoring for large organisations
Easy, Big and Mostly Reliable Network Performance Monitoring for Large Organizations
If you're looking for advanced monitoring, NPM has it - but it falls short
SolarWinds Network Performance Monitor (NPM) - Know Your Network
SolarWinds Network Performance Monitor provides clear insight and usable information
SolarWinds Network Performance Monitor (NPM) Review
Not impressed but not disappointed either.
Reveal Positive Solutions to Hidden IT Issues with SolarWinds NPM!
Awards
Products that are considered exceptional by their customers based on a variety of criteria win TrustRadius awards. Learn more about the types of TrustRadius awards to make the best purchase decision. More about TrustRadius Awards
Popular Features
- Alerts (228)8.989%
- Hardware health monitoring (215)8.888%
- Network monitoring (231)8.787%
- Customizable reports (212)7.979%
Pricing
NPM
$1,638
Entry-level set up fee?
- Setup fee optional
Offerings
- Free Trial
- Free/Freemium Version
- Premium Consulting/Integration Services
Product Demos
Why I Recommend SolarWinds Network Performance Monitor (NPM)
Features
Network Performance Monitoring
A network performance monitoring system monitors the entire network for performance problems and collects performance data such as network traffic analysis performance bottlenecks, etc.
- 7.8Automated network device discovery(210) Ratings
Automated network device discovery allows all devices in the environment to be found and tracked
- 8.7Network monitoring(231) Ratings
Monitoring network device availability and performance indicators like bandwidth, packet loss, CPU, WAN links, etc.
- 8.1Baseline threshold calculation(201) Ratings
Calculation of baseline thresholds so to establish warning thresholds
- 8.9Alerts(228) Ratings
Alerts warning of critical infrastructure component failure can be sent via email or SMS or other channel
- 7.8Network capacity planning(188) Ratings
Capacity planning analyzes interface utilization, disk usage, etc. and allows identification of capacity problems well in advance of threshold breach
- 7.2Packet capture analysis(130) Ratings
Interception of data packets provides performance-related information such as network and application response times, and traffic type analysis
- 7.1Network mapping(190) Ratings
Dynamic mapping tool allows the network topology to be mapped showing performance metrics, and link connection and utilization
- 7.9Customizable reports(212) Ratings
Ability to schedule, generate, and deliver custom performance and availability reports
- 7.2Wireless infrastructure monitoring(153) Ratings
Ability to monitor wireless access points, controllers, and connected clients
- 8.8Hardware health monitoring(215) Ratings
Ability to monitor key hardware metrics including temperature, fan speed, and power supply
Product Details
- About
- Integrations
- Competitors
- Tech Details
- Downloadables
- FAQs
What is SolarWinds NPM?
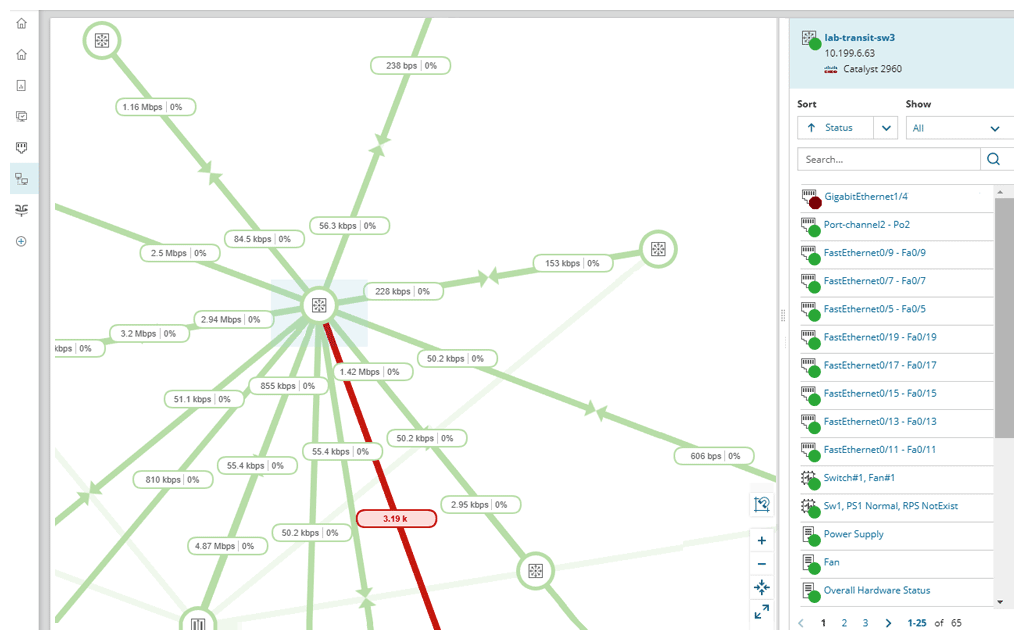
SolarWinds Network Performance Monitor (NPM) delivers comprehensive network fault monitoring and performance management that scales and expands with a company's network monitoring needs. Users can collect and view availability, real-time and historical statistics from routers, switches, firewalls, servers, and any other SNMP-, ICMP-, or WMI-enabled devices directly from a web browser.
The vendor states that SolarWinds users can get a full NPM installation up and running the same day they download, and that implementation does not require a team of consultants. NPM provides visibility into the health of network devices and servers on the network, ensuring that users have needed real-time information to keep their network running at peak performance.
Network Performance Monitor helps IT Pros:
- Detect, diagnose, and resolve network performance issues and avoid downtime
- Respond to multiple condition checks, correlated events, and device dependencies
- Automatically calculate capacity exhaustion dates using customizable thresholds based on peak and average usage
- Streamline network troubleshooting with a Web interface
- View paths to critical business services hop-by-hop, even into the cloud, with the NetPath™ feature
- Get deeper visibility into complex network devices with Network Insight™ features for Cisco ASA firewalls, Cisco Nexus switches, and F5 BIG-IP load balancers
SolarWinds NPM Features
Network Performance Monitoring Features
- Supported: Automated network device discovery
- Supported: Network monitoring
- Supported: Baseline threshold calculation
- Supported: Alerts
- Supported: Network capacity planning
- Supported: Packet capture analysis
- Supported: Network mapping
- Supported: Customizable reports
- Supported: Wireless infrastructure monitoring
- Supported: Hardware health monitoring
Additional Features
- Supported: Seamless conversion upgrade to AIOps-powered Hybrid Cloud Observability
- Supported: Multi-vendor device support for any router, switch, firewall, VPN concentrator, wireless access point and other devices that support standard protocols
- Supported: Intelligent alerts for correlated events, sustained conditions, and complex combinations of device states
- Supported: Insight on hardware health by monitoring, alerting, and reporting on the state of key device sensors
- Supported: NetPath for hop-by-hop monitoring of critical business services, on-premises or into the cloud
- Supported: Network Insight for Cisco Nexus switches, F5 BIG-IP load balancers, Cisco ASA firewalls
SolarWinds NPM Screenshots
SolarWinds NPM Video
SolarWinds NPM Integrations
- SolarWinds Hybrid Cloud Observability
- SolarWinds Server & Application Monitor
- SolarWinds NetFlow Traffic Analyzer (NTA)
- SolarWinds Network Configuration Manager (NCM)
- SolarWinds Virtualization Manager (VMAN)
- SolarWinds Storage Resource Monitor (SRM)
- SolarWinds Web Help Desk (WHD)
- SolarWinds Web Performance Monitor (WPM)
SolarWinds NPM Competitors
- LogicMonitor
- OpenText Network Node Manager i (NNMi)
- Broadcom DX Unified Infrastructure Management
- Cisco Prime LAN Management (discontinued)
- ManageEngine OpManager
- Nagios Core
- Progress WhatsUp Gold
- DX Infrastructure Manager (formerly CA Unified Infrastructure Management)
- Paessler PRTG
SolarWinds NPM Technical Details
Deployment Types | On-premise, Software as a Service (SaaS), Cloud, or Web-Based |
---|---|
Operating Systems | Windows, Windows® Server 2016; SQL Server 2016 SQL Server 2016 SP1 SQL Server 2017 (including installations on Linux) |
Mobile Application | No |
SolarWinds NPM Downloadables
Frequently Asked Questions
Comparisons
Compare with
Reviews and Ratings
(600)Community Insights
- Business Problems Solved
- Recommendations
Users have found this product to be extremely versatile and useful in a variety of situations. One key use case is for professional presentations. Users have praised the product for its ability to create visually appealing and engaging slides that captivate audiences. The ease of use and intuitive interface allows users to quickly create polished presentations without the need for extensive design skills. Additionally, the product's extensive library of pre-designed templates and customizable options provide users with a wide range of choices to cater to their specific needs.
Another important use case for this product is for educational purposes. Teachers and students alike have found value in using this product to enhance their learning experience. With its interactive features such as animations, videos, and quizzes, it enables educators to create engaging lessons that capture students' attention and facilitate better understanding of complex concepts. Users appreciate the product's collaborative capabilities, allowing for seamless group projects and real-time feedback.
Furthermore, this product has proven to be a valuable tool for businesses in creating impactful marketing materials. Users have reported that the product's drag-and-drop functionality makes it easy to design eye-catching brochures, flyers, and social media graphics. The ability to seamlessly integrate images, text, and various graphic elements ensures that businesses can create visually appealing marketing materials that effectively communicate their brand identity.
Lastly, users have praised the product's ability to simplify personal projects such as photo albums or event invitations. The variety of customization options allows users to personalize their creations and add their own touch. Whether it's creating personalized greeting cards or designing stunning wedding invitations, this product has been a reliable choice for users seeking high-quality results without the need for extensive design knowledge.
Overall, this product has proven to be versatile and adaptable in various contexts, making it an indispensable tool for professionals, educators, businesses, and individuals alike. Its user-friendly interface combined with its extensive features and customization options allow users to unleash their creativity and achieve impressive results in a wide range of use cases.
Users recommend considering the whole stack of Network Modules on the SolarWinds platform instead of NPM as a standalone product. They believe the other modules are valuable additions for monitoring, managing, and analyzing the network. SolarWinds NPM is considered the best network performance monitoring solution on the market. Users suggest using it for network monitoring and exploring other modules for specific infrastructure monitoring. While NPM is a good tool for network monitoring, users advise looking into alternative options for advanced monitoring needs. Some users suggest improving the navigation to make it more fluid and user-friendly. Overall, users recommend SolarWinds NPM for managing and monitoring network infrastructures due to its reliability and cost-effectiveness. They also recommend trying the live action feature and Meraki for enhanced network analytics. Users suggest considering other products with better UI and capabilities. SolarWinds NPM is worth the price if affordable, especially with sponsorship. Working with third-party services or SolarWinds to properly set up the tool is recommended. Using multiple tools in conjunction with NPM provides more visibility. Users recommend signing up for Thwack and utilizing their resources for assistance with SolarWinds products. Trying the demo first before purchasing is advisable. NPM is considered a core module in every company that chooses SolarWinds as their monitoring tool. It is important to ensure that the server can handle the software. Experienced staff maximizes the benefits of the platform. Users suggest downloading a trial copy of NPM to test it out. NPM outperforms other tools according to user opinions. More theme options and additional ways to export data are requested. Other modules from SolarWinds that work well with NPM, such as Server & Application Manager, should be explored. Support team and Thwack community are highly praised by users. Users should not be overwhelmed by features and take advantage of free trial resources. SolarWinds is recommended for enterprise-level monitoring, but Loop1 consulting is advised for complex environments. Initial setup can be time-consuming. The 30-day evaluation of the full product is excellent. Becoming a Thwack member provides access to extensive resources and support. SolarWinds may have a higher cost but is considered worth it. Proper provisioning of hardware, software, and infrastructure is crucial before deploying SolarWinds. Users recommend setting up the trial version first and getting familiar with the product. SolarWinds NPM receives high recommendations from users and is praised for its great dashboards.
Attribute Ratings
- 9.3Likelihood to Renew27 ratings
- 10Availability2 ratings
- 9Performance2 ratings
- 9Usability21 ratings
- 8Support Rating28 ratings
- 8Online Training2 ratings
- 10Implementation Rating7 ratings
- 9Configurability2 ratings
- 10Product Scalability2 ratings
- 7Ease of integration2 ratings
- 9Vendor pre-sale2 ratings
- 9Vendor post-sale2 ratings
- 7.2Solarwinds Premier Support Rating11 ratings
- 1SolarWinds Smart Start Support Rating1 rating
Reviews
(1-25 of 96)The way to monitor your network.
- Custom reports building.
- Alert management with conditions constructor.
- A huge variety of data sources.
- Web console requests cashing works quite slow - I assume Redis configuration should be improved.
- Network elements virtualization and clustering monitoring do not satisfy the contemporary requirements (has to be more functional and provide a wider list of vendors).
- WiFi heatmap is available for Cisco Meraki equipment only.
NPM is a great tool for your networking team!
- Monitor Cisco devices in general
- Monitor Azure Gateways
- Provide different kind of reports
- Provide different kind of alerts
- Pollers for Aruba Devices
- The SolarWinds support team is not familiar with non-Cisco vendors, so it's hard to get some support from them.
- Bugs sometimes is happening
- Sometimes the Dashboard delays to show the current status of Nodes/Services
- Alerting network device status down/up
- Monitor devices for hardware status
- Monitor bandwidth usage
- No improvements needed
SolarWinds NPM brings all your Network Tools into a single Toolbox
- Excellent Network Reporting
- Great performance monitoring with various KPIs
- Proactive alerting with alerts when approaching set thresholds
- It would be great to have Root Cause Analysis built into the platform
- The Network mapping feature could use a friendlier interface
- The Network Monitoring Platform does not include the Topology Mapper.
Single Window Network Performance Monitoring
- Device Health Monitoring
- NetPath - network path analysis
- Performance monitoring of devices - utilization of resources like CPU, Mem, Interfaces
- Specific vendor monitoring with Network Insight - Cisco, F5, Palo Alto
- NetPath scaling for very large environments like Banks
- Drag and drop functionality in Reporting
- Drag and drop functionality in Dashboards
- Notify us when a network device goes down and comes back online.
- Reports for network interfaces.
- Fairly simple to add or remove a network device.
- The software upgrade process is a little hairy and has caused me trouble on occasion.
- The server that it needs to run is a bit of a resource hog along with the SQL server.
- Some additional features like the network map are a bit clunky compared to some other products that we use.
Not impressed but not disappointed either.
- Aggregate date
- All in one interface
- Supports SNMP and NetFlow
- Can see route of packet across the internet to destination server
- Simplify interface
- Simplify installation
- Price
- Identifies IP addresses, hostnames, packet loss, and latency
- Displays top talkers per each monitored interface
- Path offers device details and detects configuration changes
- Detailed (potentially multi-path) map between Windows node and a specified destination
- Customizing the NPM interface is capable of a multitude of instructions in the Virtual Classroom via the SW website.
- Customizing the threshold values and which interfaces to monitor are configurable by many videos in the Virtual Classroom on the SW website.
- Customizing the active alerts' values are configurable by following directions and video instruction guides in the SW Virtual Classroom on the SW website.
Best Network Monitoring Tool out there
- Monitors all the switches
- Alert when a network device is down
- Monitor bandwidth usage across the network
- Monitor Hardware health on devices
- Bandwidth monitoring could be improved, when creating a map we need to either show bandwidth usage or interface speed. I would like to see both
- Wireless heat maps could be improved. It only works with certain vendors
SolarWinds
- Up/Down status
- Bandwidth utilization
- Alerting
- auto discovery
- UI performance
- Perfstack is a feature we have started using heavily and our resident programmer/script expert is working on a script to pick out a FLOW conversation, get all the switch ports between the two endpoints and generate a perfstack of them. This is looking like it could be very useful for troubleshooting.
- The modern dashboards have real potential and I like how they auto-refresh each widget independently.
- SolarWinds Network Configuration Manager and Netflow Traffic Analyzer are great as always. NCM in particular makes my life so much easier.
- Please work on the Universal Device Poller to get it on the web.
- Consistent sorting would be really nice. There are places where things are sorted alphabetically and other places where they're sorted by creation date (which makes no sense).
- Live maps. I like the direction you're going, but it still needs a lot of work just to get it on par with Network Atlas, and I hope you're aiming higher than that because Network Atlas is just not that great.
NPM in PNW!!!
- Network Mapping. The Network map is an absolute must for any multi regional organization that requires a holistic view of how the networking SLAs are being met.
- Network Atlas should be a process added to the console instead of having to access it to build the maps on the servers.
- NetPath services are a godsend when you are trying to explain to ISPs, etc. about where traffic is congested or stopping. Sometimes seeing is believing for them.
- The other BIG deal is anticipating disk capacity - when volumes get to full, servers crash. With NPM, we can and create set thresholds for warning us before we run into issues, and then we can add storage, memory, and CPU, (especially on our Virtual environment.)
- Alerts are great - instead of hearing from our users that a server is offline, we are aware of it right away.
- We also like the alerts that le us know when there are upgrades available.
- It would be nice to be able to set up SNMP3 for some of our systems in an easier fashion. But it is not a show stopper.
- Sometimes the support refers us to the Knowledge base and Thwack. Not a huge deal, but I only end up putting in a ticket when I have spent a great deal of time searching for a solution.
- Email alerts sometimes go wonky after an upgrade.
An EKG for your servers
- Alerting with custom thresholds
- Dashboards to give you a real-time view into the health of your systems
- Reporting capabilities are well sorted
- Need a more intuitive way to configure interfaces between nodes in map editor
- I would also like to see an improved method for auto-provisioning of server monitoring tools
- Cost
Level 1 user who appreciates the power of NPM more every day.
- Clean and logical layout means you get in and out quickly
- Easy to set up the status monitoring (SNMP, pings, etc.)
- Easy to make a graphical presentation of the network
- It takes a long time to load when I ask for the monitoring UI.
- It would be nice to have links to tutorial videos within the UI.
- I wonder if Atlas could be cloud-based so we don't need to host it.
SolarWinds NPM
- Alerting with custom thresholds.
- Reporting capabilities to easily see historical data.
- Dashboards to give you a real time view into the health of your systems.
- Configuring thresholds for your alerts can be a little cumbersome.
- Getting additional details onto the alerts is not as easy as it could be.
- You need to have two servers to run SolarWinds NPM, one for the service and a separate one for the database.
SolarWinds Network Performance Monitor
- Nice single pane of glass view of whole network
- The ability to tailor each department with their own tools to use
- Lots of out of the box features that just work
- Quickly and easily run down issues with lots of different scenarios throughout the network
- The ability to create custom pollers for unique situations
- Some of the tools are a little cumbersome to get the hang of
- The need to learn to use the SWQL language for advanced monitoring and reporting
- The cost compared to other companies out there
SolarWinds NPM review from a solution designer
- Modern Dashboards
- Interface details
- Node details
- CPU, MEM & VOL capacity forecast
- Audit log
- Errors dashboard
- API integration with Meraki, Velocloud, Viptella
- Orion DB tables dedicated to Meraki, Velocloud, Viptella data fields
- UML flows for NPM
- Documentation of SD-WAN integration
- Feature requests are very slow to be implemented.
SolarWinds NPM Customer Review
- It pulls SNMP data well, in particular it allows us to capture port level information with a decent amount of historical data. This is true for user ports or trunk ports.
- It does a good job of keeping an up-to-date stable of configurations. This is invaluable for recovery operations.
- Syslog collector is also very useful to again correlate performance data against what errors the box itself is processing.
- I would like to see the robustness of the database and pollers improved. It seems like we often need to do system upkeep or the application seems to grind along very slowly.
- I would also like to see an improved method for auto-provisioning of server monitoring tools.
- I would also like to be able to update maps/drawings directly from the web interface without having to use a separate Windows client.
SolarWinds NPM is the magic bullet!
- The software is very in-depth. You will be able to get metrics and data on things you never thought possible.
- SolarWinds has a vast array of products in its database so we have yet to add anything that wasn't already included.
- The reporting is wonderful. It is in-depth and allows us to provide documents to business partners when asked.
- Sometimes there are too many things to look at. It may be hard to find just what you are looking for. I would prefer a more dumbed down interface or even a guided wizard.
- It may be our implementation but it seems a little sluggish at times.
- Upgrading it can be a pain since there may be multiple updates needed to get current.
SolarWinds Network "Magnificent Performance" Monitor
- Providing detailed and high-level views of network device and infrastructure performance
- Providing an intuitive and informative user interface
- Generating flexible, customizable reports for any combination of devices imaginable
- Providing highly extensible device metadata categories and custom properties
- SolarWinds is an expensive platform with steep initial and recurring costs (if maintenance/update services are purchased).
- The amount of information in the Orion interface can be intimidating if you don't know what specific information you're looking for.
- Monitoring the uptime, latency, statistics, and other metrics for individual device performance
- Reporting on device availability and metadata
- Identifying problem areas of the network down to specific interfaces
- Network/IT device asset management
- Small-scale business operations
SolarWinds NPM Review
- Monitors and alerts on network device metrics
- Adding a device is easy and device templates are accurate
- The user interface is intuitive and packs information densely on the screen for easy use.
- Configuring and monitoring at the port level can be confusing. Often level 1 technicians misconfigure what ports actually need to be monitored. More common on larger or more complex devices such as core switches.
- The top-level menus in NPM (and all of SolarWinds Orion tools) are not always intuitive.
SolarWinds Network Evaluation
- Building service groups based on multiple aspects and technologies allowing for monitoring of a full service as opposed to the individual aspects of it.
- Ability to pull and organize information with custom snmp pullers means we are able to monitor and report on any event that occurs in our network.
- The ability to create additional pages and gather custom information to create simple and easily accessible locations vast improves our ability to understand and react to network related events.
- Custom page layout in NPM only allows for vertical columns of information, limiting your ability to display information in the best manner.
- Universal Device Poller is a separate application that would be much more user friendly if it was incorporated directly into the NPM web interface.
- High Availability failover solution requires additional licensing from third parties to utilize.
- Traffic monitoring.
- Link performance.
- Device uptime.
- Detailed reporting.
- Price.
- More integration options.
- User friendly interface for juniors.
Monitoring the link between your branches is vital for your production systems and performance reporting.
Network Device Port Monitoring
Monitoring the ports on your switches for throughput and if they are up or down is very helpful.
- The clarity of the NPM interface is unparalleled in the level of information displayed. This is often a challenge on other monitors when there is such a variety of equipment being monitored.
- Adding a node to be monitored is generally a stress-free process, with a lot of configuration available, but only the bare minimum being compulsory.
- The graphing provided for nodes provides us with enough knowledge to prevent noticeable failures in many cases. No need to click too many buttons.
- I have found the configuration of alerts to be somewhat confusing at times. I like to have as few required fields as possible to start with, and tailor the alert from that.